Tag Archives: Conflict

The importance of ‘micro-distances’ and individual characteristics for household surveys: understanding riots from Maharashtra to Assam

Posted by Jaideep Gupte

‘Communal violence’, as ethnic riots are termed in South Asia, is one of the major types of violence in evidence in the region today. Not only is it endemic and recurrent in ‘flash-point’ parts of the region, it is also wide spread. Data shows India experienced an average of over 64,000 riots[1] per year over the last decade, while 16 out of 28 of its states experienced more than 1000 riots in 2010.[2] In Maharashtra, where our panel study[3] is based, riots were initially infrequent, increasing drastically during the late 1970s, peaking in the early 1980s and have since remained at a high level of approximately 6000 riots per year spread across the state. Furthermore, while rioting has consistently fallen since the 1990s across India, Maharashtra stands as an exception.

The North-eastern state of Assam, virtually at the other end of India’s expanse from Maharashtra, is currently in the news as rioting there has killed over 50 in the past few days.[4] The media has been quick to latch on to the ‘communal’ nature of the violence, describing the violence as between Hindus and Muslims. But this categorisation has been conflated with a variety of explanations, ranging from having religious to political underpinnings, and even to issues of illegal immigration of Bangladeshi’s into the region. These categorisations all share some degree of truth. The region shares a very porous border with Bangladesh, with scores migrating seasonally (and illegally) into India in search of employment. A large number are also permanently settled in India, and remit earnings to Bangladesh. This situation has given the media ample cause to portray the current violence as between immigrants and the local Boro community, who are involved in their own struggle with Delhi for autonomy in the Boro Territorial Autonomous District (BTAD).

However, our research on rioting in India underlines that communal and ethnic categorisations are incomplete (see MICROCON Working Paper 62).[5] They do not fully capture the processes of perpetration, impacts or mitigation of the violence. There are five reasons for this: (1) First and foremost, is that the term ‘communal violence’ has been derived out of an imprecise historical usage – an argument persuasively put forward by Gyan Pandey.[6] The term was coined during colonial times to refer to local groupings, the nature of which the colonial presence failed to fully understand. (2) is that the terms ‘communal’ or ‘ethnic’ imply the violence is at a large scale, between entire communities or ethnicities. This hides the immensely destructive potential of smaller bouts of rioting, which can completely re-order day-to-day normality. (3) is that a wide variety of groups and actors are involved in bouts of rioting, and not all of these can be classified as communal or ethnic. Hindu-Muslim riots have also involved tribal communities (in Gujarat, for example), while the police have often been directly involved in the perpetration of violence around episodes of rioting. (4) is that women and men experience riots in varied ways, the nuances of which cannot be generalized by associating one gender with ‘the victims’ and the other with ‘the perpetrators’. Women are just as likely to perpetrate violence, as they are likely to be involved in its mitigation. Importantly, synergies and parallels between the experiences of women and men across ‘communities’ are often far stronger than those within communities. And (5) is that individual characteristics are crucial in determining how and by whom riots are perpetrated and experienced. A person physically perpetrates violence in public for a wide variety of reasons, not all of which are clearly understood through communal or ethnic framings. In my research I find that rioting often involves ‘dispossessed’ individuals, who partake in public riots to showcase individual strength.[7]

Understanding household vulnerability to violence

So how might vulnerability to such violence be accurately understood? In Maharashtra, where we’re studying 45 riot-prone neighbourhoods across nine districts, one of the significant factors is where the violence is perpetrated and experienced in relation to a number of local spatial characteristics, measured by what I term as ‘micro-distances’. I have not been able to find a more appropriate term in the literature to describe the small distances which individuals cover in no more than a few minutes by foot in their day-to-day lives – walking on the footpath, going to the market, school or neighbours house, for example (if there is a more appropriate term already in the literature, please point me in the right direction!). Indeed, I would argue that this kind of information, which describes each respondent household through a plethora of spatial information, would be an important addition to any household survey on poverty and vulnerability. Some surveys tend to retrospectively locate households by matching or comparing addresses. As I have explained in a previous blog however (Attrition: the scourge of tracing), this is not an easy task – ‘fourth house from well’ could be right next to ‘house near to temple’.  As social animals, how we interact with our surroundings and how our surroundings impact upon us are important in defining who we are and arguably, have a bearing on our development outcomes. Spatial information locates households within this space, and allows additional levels at which household data points can be interacted with one another.

Are micro-distances important and significant?

We find that they are. For example, how perpetrators, victims and witnesses relate with their belligerent neighbour, live in a dark alley way, are affected by a faulty water pipeline, or live far from public toilets, adds values to our understanding of riots which cover much larger areas. These distances not only help characterise vulnerability of secluded or peripheral households, but also help identify important nuances of vulnerabilities faced right across the spaces in which violence occurs. Preliminary analysis of spatial data from our sample neighbourhoods reveals that even though sustaining physical injury to person or damage to one’s property is a rare event during a riot, with only 0.03% of households in our sample falling under this ‘acute’ category (even though over 71% of our survey sites were affected by at least one riot), almost all such victims live within a 5-minute walk of another acute victim. In the adjoining picture, I show this pictorially for 14 of our survey sites. The maps shows a variety of data including roads/pathways, waterways, open spaces/gardens, bridges, police stations, schools, markets, clinics and gyms to name a few. Acute victims are plotted as red hexagons, and a 2.5-minute perimeter is highlighted in orange around each of them. Overlapping perimeters indicate that acute victims are within 5-minutes of one another. If we had not collected spatial information, it would not have been possible to locate vulnerability in this precise manner.

This preliminary result suggests that violence in riots that are purportedly ‘organic’, erupting suddenly as a result of long standing friction between communities, is in fact not singular or monotone. But it is formed of more complex events where violence is perpetrated at multiple levels, involving more brutal acts as well as minor offences. In Assam, it cannot be doubted that (illegal) immigrants are present and involved in the violence, neither can it be doubted that there are local groups who are already mobilised over a struggle to be autonomous. However, local scholars who have engaged with the under-currents leading up to the violence find “this tendency to conflate conflicts into easily identifiable ethnic constituencies simplistic, leaving little scope for either understanding or intervention”.[8] Because this violence so deeply affects already strained livelihood strategies, further (read long-term) research will undoubtedly reveal that issues of authority and legitimacy – at the individual level – are at the core of the violence. By this I mean that in situations where individuals feel economically, politically and socially dispossessed, being publically violent is an extremely effective strategy to showcase one’s capacity to provide for one’s household. Using micro-distances as I have suggested above, or other more locally specific micro-level analyses, is key in accurately understanding the vulnerabilities that directly and indirectly impact upon the individuals that perpetrate and experience riots. To this end, they can also explain much about why riots occur when and where they do, and importantly, who participates in them and why.

[1] Defined loosely under Section 146 of the Indian Penal Code as “Whenever force or violence is used by an unlawful assembly, or by any member thereof, in prosecution of the common object of such assembly, every member of such assembly is guilty of the offence of rioting.”

[2] Crime In India, various years. New Delhi: National Crime Records Bureau, Ministry of Home Affairs, Government of India.

[3] With Patricia Justino and Jean-Pierre Tranchant. Funded by the European Commission (www.microconflict.eu) and the DFID-ESRC (“Agency and Governance in Contexts of Civil Conflict” http://www.esrc.ac.uk/my-esrc/grants/RES-167-25-0481/read).

[5] Gupte, J. 2012. What’s civil about intergroup violence? Five inadequacies of communal and ethnic constructs of urban riots. MICROCON Research Working Paper 62, Brighton: MICROCON

[6] Pandey, Gyanendra. 1990. The Construction of Communalism in Colonial North India. New York: Oxford University Press.

[7] Gupte, Jaideep. 2011. “Extralegal security and policing for the urban dispossessed in Mumbai.” In Urbanizing Citizenship: Contested Spaces in Indian Cities, eds. R Desai and R Sanyal. New Delhi: Sage.

[8] Barbora, Sanjay. 2012. “Identity of a recurring conflict.” The Hindu, July 31st. Available from http://www.thehindu.com/opinion/lead/article3704450.ece?homepage=true (Accessed on 31/07/2012).

Implementing Experimental Games in Violence-Prone Neighbourhoods

Posted by Jean-Pierre Tranchant

As part of our study on violence-prone neighbourhoods described by my IDS colleague Jaideep Gupte [in his recent posts on attrition and tracing households across Maharashtra], we implemented behavioural games in conjunction with the second wave of our household survey. Trust, norms of fairness, or social cooperation are difficult to measure with household surveys, as responses might not relate to actual behaviours in an accurate manner. Experimental games have become a very popular solution to observe complex behaviour without the investment of a long term ethnographic study. [1] A useful game is a game that gives precise and predefined cues to respondents so that they form their decisions as they might in a real-life situation, and allows respondent decisions and behaviour during the game to be recorded for analysis. A good knowledge of the culture under study is then still needed to understand how people will play the game and draw appropriate interpretations. [2]

The main questions we are interested in answering through the games are around the role of social cooperation in conflict: does social cooperation mitigate conflict or is social cooperation a by-product of the absence of the conflict? Alternatively, is there a possibility that social cooperation actually makes conflict more likely? We also wish to shed light on the impact of ethnic, caste and religious heterogeneity on cooperation.

In this post, I would like to share our experience of actually running these games in the field. Most of the literature on experiments is about lab experiments – a highly controlled process where participants (usually graduate students) are seated in front of a computer. Field experiments, on the other hand, are much less controlled, and issues related to the organisation of games can have a large impact on the results.

We had to struggle between the conflicting needs of consistency and flexibility.  Running games across 45 sites in 9 districts in a state encompassing over 300,000 sq. km necessitated following strict procedures in order to maintain consistency across the games. Logistical realities, however, called for slack in the system so that we could adapt each game. Some of the questions we faced when implementing the games were – How many games to run? How many participants per game? Where to organise the games? and How to record individual decisions? The following insights come from two pilot sessions organised in Sangli and Kolhapur districts, at the border with the state of Karnataka.

How many games to run?

We had two extreme options here. One was to run one game session in each of our sites. This would have some advantages: it leaves more time for the team to recruit participants, the venue can be chosen to be very close to the site, and the number of participants remains small (our capacity to run games goes down with number of participants). But it involves organising 45 different sessions, thus increasing the cost, and preventing interactions between participants from different sites. At the other end of the spectrum, we could run a single game session in each district, pooling participants from all 5 sites. This would have the reverse virtues (less costly, possibility of inter-neighbourhood/town interactions) and caveats (too many participants, difficulty to recruit because of the distance). We opted for a middle-ground: we organised 2 sessions per district, one with participants from 2 sites together, and the other one with the three remaining sites. Since our sites are usually close to each other (within a city), this could be done without sacrificing proximity to the sites.

How many participants per game?

The protocols we designed were such that it was best to have a fixed number of participants per site, i.e. 6, across all games. In terms of logistics however, it is much easier to allow for some variation around a fixed target, without having to stick to it at all cost. Our team would go to the survey site one day before the games to formally invite 10 people per site (allowing 4 back-up for people not showing up on the day). They were promised 200 rupees for coming, plus the chance of earning more based on the outcome of the exercises (we did not speak of ‘games’ but of ‘exercises’). Importantly, the variable part of the payoff remained undetermined in order not to raise false expectations. Larger groups of participants are always preferable, but with 6 people per site we achieve a sample of 270 participants, producing statistically meaningful results. A higher number of participants would have proved extremely challenging in terms of recruitment, also we would need more cars to ferry participants to and from the venue, the venues themselves would have to be bigger and so on.

The selection procedure was random, i.e. we produced a list of households in each site where the ordering was random but stratified so that households with experience of civil violence were oversampled. Somewhat to the surprise of the team, we did not face much difficulty recruiting enough participants.

We faced more difficulties on the day of the game: our biggest problem was with people arriving late at the venue. We decided to play the games in venues close to the sites, so that some would be able to walk there if they wished so, rather than being dependent on our team’s car. On one occasion we had 17 participants in the venue waiting with increasing restlessness while waiting for the last participant to show up (she came by foot). Sticking to the protocol required us to wait, risking some people walking away. Starting the game with 17 would create an idiosyncratic deviation from the protocol. We decided to distribute tea, which created a respite of 5 minutes, but then came short of strategies. We finally decided to start as it was, and just as things had started, the 18th person walked in…

Where to organise the games?

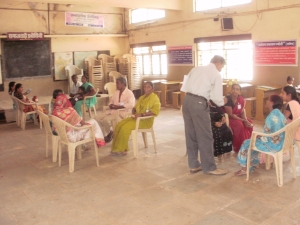
As I mentioned above, we decided to go for venues close to the sites. A concern of the team was that people from different caste would not want to mix in the same car. Similarly, in more conservative segments of the society, women might not want to enter a car with men. Having venues so close that people could walk there was a way to address such problems. Additionally we chose venues that were neutral (not overtly religious for instance) and not intimidating for our respondents. We ended up using a public library and a marriage hall. Such venues are plentiful in urban India, and quite inexpensive to rent for the day. Even better, there was no need to plan much in advance.

How to record individual decisions?

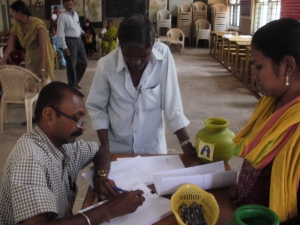
This is a big question, each individual decision for any given round of any given game must be carefully recorded for later analysis but also for calculating individual payoffs to be distributed at the end of the session. In addition, the context in which players make their decisions is important to ensure anonymity, and lack of pressure. We could not use computers because most of the elder respondents are illiterate and/or unfamiliar with them. Instead we set up two or three ‘decision tables’ in each session staffed by a member of the team. In turn the participants would walk there alone, and from a distance to others make their decision known. We exploited this moment to ask post-decision questions which were useful for later interpretation. The pitfall was the time needed for each participant to walk the table for each decision, thereby slowing down quite a lot the rhythm of the games. At the decision tables we presented the money in front of the players and then asked for their decisions. In retrospect I think it would have been better to hand the money in envelopes to the players, thereby increasing their ownership of their endowment, and make altruistic decisions more costly.

Overall the experience was hugely positive. Importantly, all participants enjoyed their time – and were delighted when they discovered their payoff (average of 730 rupees). The team grew more comfortable at each iteration of the games and as their understanding of the games increased, so their enjoyment in running them. One can think that designing the game would be the most time-consuming part of the process but in fact this was done quickly. Rather, the logistics and the minute organisation of the games (who sits where, who plays first, where to play, etc) took a much bigger chunk of our time. Once we had a strategy in our mind, we ended up spending a lot of time buying stuff like pots, scissors, papers, badges, etc, and printing loads of papers. Working in an urban environment meant that we could do all that on the sites. Our PhD students Alia and Yashodhan, somewhat strained by weeks of fieldwork and painstaking data checking, regained all vitality playing arts and crafts. And seeing actual people playing games you so painstakingly designed was an incredible reward.

[1]Within MICROCON see Voors, M.J., E.E.M. Nillesen,  P. Verwimp, E.H. Bulte, B.W. Lensink and D.P. van Soest, 2012. Violent Conflict and Behavior: a Field Experiment in Burundi, American Economic Review, In Press or Lecoutere, E. B. D’Exelle, B. Van Campenhout, 2010. Who Engages in Water Scarcity Conflicts? A Field Experiment with Irrigators in Semi-arid Africa. MICROCON Research Working Papers 31

[2] For an excellent account on how field experiments relate to ethnographic knowledge see the collective book Foundations of Human Sociality: Economic Experiments and Ethnographic Evidence from Fifteen Small-Scale Societies, published in 2004 and edited by Henrich, Boyd, Bowles, Camerer, Fehr and Gintis.

Attrition: the scourge of tracing

Posted by Jaideep Gupte

We have now completed four out of nine districts[1] (my earlier post describing our panel study can be found here), although for logistical and security reasons, by the time this is posted, our fieldwork would already have been completed.

In the excitement and busy schedule of our fieldwork, it is easy to forget that some of the areas we are visiting, or travelling through, are not the safest. This afternoon as we were travelling between districts on a quiet stretch of road, our jeep was stopped by a gang of 10-15 young men (some were boys) who demanded a payment to let us through. From what I could see, they were unarmed. It was a routine I had seen before: a few of the boys lay down across the tarmac, a few raised their arms up high as if in prayer, while the others linked arms and crowded the single lane road to bring us to a halt. As soon as we did, the gang held on to the grill of our jeep till we opened the windows to talk. They claimed the payment was to be put towards the upcoming celebrations for Ambedkar Jayanti. However, the annual remembrance celebrations of Dr. Ambedkar, a prominent Dalit leader, were more than a fortnight away. Besides their initial ‘primordial’ display, the gang was very articulate, and talked to us in a calm manner; they even gave us a receipt for our payment. Our seasoned driver handled the negotiation calmly, and told us afterwards that all such proceeds would most likely be used to acquire tharra (moonshine).

Attrition, or the fact that households initially included in the sample are missed in subsequent waves, is the scourge of panel studies. This is because attrition in social surveys is rarely ‘at random’, and can therefore quickly eat away at the validity and reliability of the data. Because our panel study on household vulnerability to civil violence is the first of its kind in India, we had very little prior knowledge to estimate the magnitude of attrition rates we would face. Other panel study’s in India have experienced around 20% attrition,[2] but these are much larger samples over much longer periods of time. We are aiming for half that – a tall ask, specially given the urban and peri-urban, and at times, unstable nature of our sample.

We are tracing 1089 households, but a large part of our study also uses the neighbourhood as unit of analysis. For one, we are interested in seeing how neighbourhood level dynamics interact with household vulnerability. It is therefore important to maintain households as well as neighbourhoods within our sample. For this reason, our tracing protocol is slightly different from a standard household panel in that if we find that a respondent household has moved out of our neighbourhood, it makes little sense in us tracing that household.[3] We treat that household as a lost household, and replace it. We only trace relocated households if they have moved within or near the original neighbourhood. We also often find the exact house, but with nobody at home – in these instances, we wait; as long as our budget allows. In some sites, when neighbours mentioned that members of our respondent household had gone to the market, or were away temporarily, supervisors returned to a house four or five times in a day to check if the family had returned. This is repeated on following days if the team is surveying sites in the same city or district.

Overall, we are managing to keep attrition to a bare minimum – we have only replaced a handful of households. A few lessons we’ve learned along the way:

  1. Nearly all of our successful traces are due to our GIS information.
    1. Why GIS and not GPS? GPS is a ‘positioning system’ technology which uses satellites to triangulate position, while GIS refers to tools which map ‘geographic information’, which may or may not use information from satellites. In dense slum areas or inside tenement blocks in state-provided housing projects, for example, GPS is of little use in finding the exact door at which to make our survey call. A few meters here or there, means you end up walking down the wrong lane, and it can be extremely time-consuming to re-trace steps. We therefore relied on GIS maps.
    2. Neighbourhood mapping: addresses in low-income neighbourhoods in India are monotone, particularly so in informal settlements. At times, several hundred families will all identify their residential address by a common local landmark (a shop, mosque, temple, cross-road, or “under flyover bridge” for example). So neighbourhood level mapping becomes essential. During the first wave, we painstakingly mapped each survey site, marking down most visible land-marks and adding in ‘voting booth zone’ demarcation information used by the Election Commission. This information proved to be highly effective on the ground, since even the smallest visible landmarks (‘the Banyan tree’, ‘the well’, or ‘small statue/idol’) are much easier to locate than street names. Local residents often wouldn’t know the names of the streets we were enquiring about, but could easily point out these visible land marks.
  2. Ensuring adherence to best-practice at the survey site: it can not be stressed enough how arduous tracing households is. The temperature in interior Maharashtra where we are is not helping – it is already above 40oC, and likely to reach 50oC in the coming weeks. We therefore had to think carefully about building in incentives to ensure attrition rates were kept to a minimum, and no households were lost due to inadequacies on our part.
    1. Replacement households are a good incentive strategy. We are requiring that the size of our sample is maintained through replacement households. Not only do these replacement households function as a second stage baseline for subsequent survey rounds, they also ensure that there is no incentive to report a household as missing. In fact, a completely new household requires more effort on the part of the enumerator since introductions, building rapport, and the household roster all have to be done from scratch. The flip side of this is that for genuine replacements, we need to ensure that the enumerator has adequate support from other team members or the supervisor if necessary.
    2. Anonymous maps – originally, our plan was to provide the enumeration team with site maps which did not show respondent household codes. The thinking was that households which appeared ‘inaccessible’ or in hard to reach areas, should not automatically be identified as such, and thus create an incentive for them to be marked as missing. However, we quickly learned that this was not working, and was counterproductively increasing the logistical workload for the enumeration team. Providing maps which displayed respondent household codes meant the team knew exactly where to look for each respondent, and this freed up much time for other tracing activities.
    3. Daily data reliability check – We’re using a mobile data capture program on Android tablets to collect our survey data (I’ve described this in my earlier post which can be found here). As soon as the day’s data is downloaded, we begin a series of reliability checks on the data – including ensuring all target households have been found or replaced, changes to household composition have been marked correctly, and several other consistency checks. We often don’t finish before midnight, but we are finding it essential to complete the checks on the day to ensure the task doesn’t pile up, and that any inconsistencies can be corrected before we travel to the next site. We also found it important to work with enumerators to correct mistakes while the interview was still fresh in their memory. We found a clear indication that doing this improved the overall quality of the data day by day.
    4. Enumerator recall. While we placed emphasis on re-hiring much of our team from the first phase, we did not rely on team members to recall the locations of sites or households. When they did remember, it was good to be able to triangulate with the GIS information. But in general, since each enumerator literally visits hundreds of households, and is so focused on the mechanics of the survey instrument, we felt it would over burden them to keep track of household locations as well. It worked well to keep the tracing duties purely within the supervisorial team, while the enumerators were simply shown the doors at which calls were to be conducted.

For the most part, our plans have fallen into place, and fieldwork completion is eminent in the coming weeks. My colleague from IDS, Jean-Pierre Tranchant has joined the travelling party in interior Maharashtra, while Patricia Justino reports that the enumeration team on the western coast has completed its sites. Next, our team moves on to conducting ‘interaction games’ with a sub-set of our respondents. We are all very excited about including this new and innovative method to study cooperation, risk-aversion and trust into our study – Jean-Pierre blogs on this next week, so watch this space!


[1] With Patricia Justino and Jean-Pierre Tranchant. Funded by the European Commission (www.microconflict.eu) and the DFID-ESRC (“Agency and Governance in Contexts of Civil Conflict” http://www.esrc.ac.uk/my-esrc/grants/RES-167-25-0481/read).

[2] For example, the four rounds of the Rural Economic and Demographic Survey (REDS) in India between 1971 and 2006 experienced 17.5% attrition.

[3] Budget constraints meant we could not do neighbourhood level surveys of the new neighbourhoods, and could only contact the relocated household if they had provided a contact mobile phone number to ask a basic set of questions on their circumstance.

Agency and Governance in Violence Prone Neighbourhoods: tracing households across Maharashtra

Posted by Jaideep Gupte

I’m writing this from Pusad, in Yavatmal district, where we have begun the meticulous task of tracing 1100 households in 45 violence prone neighbourhoods across nine districts in the western Indian state of Maharashtra. We have three enumeration teams in place. One has begun the tracing exercise from the coast, in Mumbai and Thane. Along with two doctoral students, Alia A and Yashodhan G, I am travelling with the second and third teams which have begun a westward journey from Nagpur district, roughly 850 kms east of Mumbai, by jeep.

As with the first wave of our longitudinal study[1] in 2010, the start of the second wave has been marked with the sombre news of a high casualty attack involving Maoist rebels. This time, 12 Central Reserve Police Force (CRPF) personnel were killed in an IED explosion in the neighbouring district of Gadchiroli. Initial reports suggest that 25kgs of explosive had been buried in the middle of the road, and detonated by a solitary person from less than 70 feet away. The explosion left behind a crater 6 feet deep and 15 feet wide. The CRPF men were travelling in a mini-van type vehicle, with no additional protection, and so stood no chance of survival. Discontent and grievances in these isolated tribal areas continue to be extreme, but recent government efforts pushing for inclusion have also met resistance. The union rural development minister, Jairam Ramesh, was in the area to promote tribal rights over selling bamboo, something which is currently controlled by the Forest Department. Tribals from Mendha-Lekha, a near-by village have recently become the first in India to officially be given the right to sell bamboo harvested from the surrounding forest areas. At the same time however, the villagers continue their closeness with the Maoist rebels – local police had noticed villagers had stopped using the roads in the days leading up to the blast.

The urban and peri-urban areas which our study focuses on are prone to low-intensity violence and crime. We are using GPS aided-GIS (open source Quantum GIS) to locate households and are collecting survey data on Androidtouch-screen tablets. We are using an open source mobile data capture platform called Open Data Kit, which had seed funding from Google and is now being developed by PhD students at the University of Washington.[2] Programming our questionnaires onto the tablets, localising the text into Marathi and Hindi, training the enumeration team, and building in protocols to safeguard respondents, researchers and the data from any harm has taken a huge amount of effort. But now that we’re able to start working on the data literally minutes after our enumerators leave the respondent household, is extremely exciting. For one, data cleaning can be done in real-time, and any mistakes corrected at source. Plus, we’re not carrying around stacks of paper questionnaires in our already over packed jeeps. Most importantly for our panel study however, we can also monitor attrition rates precisely.

An example from yesterday: we used GIS information from our last round to locate the exact house in which our survey was conducted (last time we randomly selected neighbourhoods, then randomly selected households within those neighbourhoods). When our enumerator starts a survey call at a house, she confirms the same family name at the address as last time. But as the data from her tablet is downloaded onto my laptop, I can compare ages and relationships to see that the current occupants are in fact members of the younger brother’s family, while the older brother has moved out with his wife and children. This changes how we interpret this household’s vulnerabilities and decisions. I can now include this household, trace the older brother’s household or replace it with a completely new household. Having real-time feedback such as this vastly improves our decisions in the field and can make tracing much more precise and cost effective. I can also see that the quantities of lentils, ghee, fruit and meat consumed or the numbers of goats or buffalo owned seem abnormal in certain households – I can see who the enumerators for those particular households are, and immediately ask them to confirm. In most cases they remember the exact details from the interview so can confirm if that was a indeed a typo, and any discrepancies can be smoothed out. In case there is still doubt, re-visiting the household is a ready option since we’re still at the site!

In some survey sites, we are seeing vast differences since we last visited them two years ago. In Mumbai, we seem to be racing against the Slum Rehabilitation Authority, who are clearing some of our survey sites for in-situ redevelopment. Slum dwellers are being given compensation to rent elsewhere while the original sites are being developed into formal/legal buildings.[3]  These families are almost impossible to trace. If we are lucky, we find that they have constructed a shack across the road or are staying on illegally to have continued access to their original sources of livelihood or access to local clinics where they have built a familiarity with the doctors. If they have moved elsewhere, even within the city, tracing them implies a huge cost and provides little added value to a neighbourhood based study.

While the enumerators are conducting their calls, it gives me a chance to briefly interact with some of the neighbourhood residents (some remember me from last time, so the conversation can last longer), take notes on the spatial layout, and to make any corrections to our maps. Here in Yavatmal district I noticed brand new high-tension electricity wires installed over one of our survey sites. Casual chit-chat at a local drinks stall reveals excitement that such development has come to the area. But, as one boy explains, the high-tension wires make it harder to splice on illegal connections, so they have to find other means of getting by – interestingly, from the data that’s already on my laptop, I can see on average the site receives electricity for 18 hours a day, which is about the same as two years ago. But there are a few households in our sample who now report less than 6 hours of electricity, while one is not connected to electricity at all. More detailed analysis might reveal patterns of who is cut-out when service provision is formalised, and whether such formalisation can reinforce segregation. In another district, two of our sites were severely affected by arson, in one almost all the shacks were burned, while in the other, the residents managed to control the blaze to small section. Again, we are hoping our panel study can reveal in more detail how this has impacted our sample, and how households cope with such shocks.

We still have a long way to go – just under forty more sites to survey. We are fortunate to have a very dedicated research team to work with, so I am hoping to report the successful completion of the data collection exercise by mid-April!


[1] With Patricia Justino and Jean-Pierre Tranchant. Funded by the European Commission (www.microconflict.eu) and the DFID-ESRC (“Agency and Governance in Contexts of Civil Conflict” http://www.esrc.ac.uk/my-esrc/grants/RES-167-25-0481/read).

[2] Recently, the Dispensers for Safe Water (DSW) program at Innovations for Poverty Action (IPA) (supported with a grant from the Bill & Melinda Gates Foundation) used ODK to significantly shorten the feedback loop from data collection to course-correction, allowing them to identify challenges with real-time data and address issues at a rapid pace – http://opendatakit.org/2012/03/ipa-and-gates-using-odk-to-improve-safe-water-systems/

[3] I have written elsewhere about the pros and cons of such redevelopment – Gupte, Jaideep. 2010. Security Provision in Slum Re-Settlement Schemes in Mumbai: A Case Study of the Lallubhai Compound Settlement, Mankhurd. Mumbai Reader 09 (1): 263-279.

Carrot not Stick: redistribution versus policing in situations of civil unrest

Posted by Dr Patricia Justino, Fellow, Institute of Development Studies, UK; Director, MICROCON; Co-director, Households in Conflict Network

A recent Economist article (‘Unrest in Peace’, 22 October 2011) explores the reasons behind recent wide-scale protest movements in Western countries, citing research that links the rise in social instability with austerity measures and increasing inequality. The author relates this outcome to events long witnessed in the emerging world, citing MICROCON research on India as a case in point. Indeed, given the current economic and social climate, our findings on the relative importance of redistributive policies for reducing civil unrest have important implications.

Governments typically intervene in the mediation and resolution of forms of civil unrest with a mix of carrotand-stick approaches. Our empirical analysis, based on data for a panel of fourteen major Indian states, found that while using coercive means to quell unrest may be effective in the short term, in the long term it can cause discontent amongst disadvantaged or disenfranchised populations, leading to greater conflict.

Compared to the use of police, redistributive transfers appear to have a more significant impact on the reduction of unrest across states. By redistributive transfers we refer to transfers that benefit those in need without necessarily distorting private investment decisions and harming economic growth. These might include programmes of public employment, investment in basic education and primary health care, food security programmes and so on.

The econometric modelling took into account other factors that have been shown to contribute to the onset of conflict, including the extent of poverty in states and across groups; the level of overall state income; and the level of education in each state. It found that the correlation between redistributive transfers and civil unrest is almost always negative and statistically significant: higher levels of redistributive transfers are associated with decreases in civil unrest. This effect is particularly significant in the long-term: the number of riots decrease by 0.3-0.4% for each extra rupee per capita spent on social services in the same period, but decrease by 10.5-12.1% for every extra rupee per capita spent on social services in preceding period. Policing is also found to decrease civil unrest in the same period that it is used; however, the use of policing tends to increase civil unrest in subsequent periods.

 Results suggest that the level of redistributive transfers across India has been sufficient to avoid the escalation of civil unrest. Whether intentional or not, and despite the small amounts spent, transfers have had a significant impact on the prevention and reduction of civil unrest in India, particularly in the medium term. The results of this analysis yield important lessons for other countries where social cohesion tends to break frequently but large-scale conflict may be avoidable.

In many developing and emerging countries that are neither high-functioning democracies nor efficient dictatorship regimes, the only way avoid conflict in the long term may be to reduce inequality. Some countries in Latin America, such as Brazil, Mexico and Peru have, over the years, exhibited a combination of high income inequalities (much higher than India’s) and high potential for socio-political conflict, while other countries have shown signs of deterioration of relatively successful social development policies (for instance, former Soviet Union republics, Egypt and Libya). This can result in increases in civil unrest. Instead of addressing the reasons that motivate population mobilisation, the use of police and military force does little more than enhance the causes of unrest rooted in perceived social injustice. In addition, the continued use of coercive force by security forces may cause resentment and further mobilisation that can increase the risk of the escalation of unrest.

The implementation of adequate programmes of redistributive transfers may have an important role to play in the establishment and/or maintenance of stable socio-political environments in those countries. Given recent events in established democracies it appears that in Western countries too, what governments need are more policies that directly address the root causes of social discontent.

Send food to Somalia – answer questions later

This blog is written by Debby Guha-Sapir and Peter Louis Heudtlass, from the World Health Organisation Collaborating Centre for Disaster Epidemiology, Louvain School of Public Health, Brussels, Belgium. It was previously published as a Financial Times Letter on 26 July 2011.

The humanitarian intervention in Libya was justified by the UN policy on a “responsibility to protect”, in this case, civilians from the aggression of forces loyal to Colonel Muammer Gaddafi. The famine in the Horn of Africa surely cannot be treated differently.

The present situation in East Africa is catastrophic and the only response is to send food immediately and ask questions later. But soon enough, questions will be need to be asked – and we have two.

The urgency of the Libya crisis allowed governments to dip into public funds to pay for costly militarised action – to the tune of £2m ($3.2m) per day for the UK alone. This says nothing of costs such as the launching of 168 Tomahawk cruise missiles within the first four days of this intervention at US$1m a shot.

In contrast, donors have been shy with their contributions towards the Horn of Africa appeal for funds. The urgent UN appeal asks $1.87bn to feed about 10m people. Available resources cover less than half this amount and come from leftover funds or from the UN Central Emergency Revolving Fund – a pooled mechanism set up to insure against the risk of overlooking victims of unpopular or forgotten crises.

Faced with a serious shortfall, humanitarian organisations are turning to private donations through personal appeals and helped by disturbing media reports on television.

First, we need an urgent answer to why we can draw on public tax money for humanitarian intervention in Libya, using air strikes to protect people, but need to get non-governmental organisations to solicit private donations from citizens to feed the victims of the famine?

Second, the wrenching famine in this very region in the mid-1980s led to several initiatives to prevent or at least to alert the world to impending famines. Humanitarian organisations also ramped up their capacity to monitor nutritional status in these food-insecure areas.

These initiatives did their job this time. They noted the rapid slide of children into severe malnutrition and sent alerts on an impending food shortage. (“Agencies warn of east Africa famine”, July 6). But not much actually happened.

Sometime soon, we need to ask how to connect up aid decision-making and famine alert systems, so response is timely and effective.

Civil violence: three steps to understanding the ‘mindless criminal’

Posted by Jaideep Gupte, Research Fellow, Conflict, Violence and Development Cluster, IDS

Last weekend, twitter and various internet blogs lit up: London was under attack. Television news repeatedly showed bewildering scenes of riotous mobs on the rampage, shops being looted and buildings on fire. As the violence spread from Tottenham to several neighbourhoods across the city, ‘copy-cat criminality’[1] and mob frenzy were blamed for the continued violence. However, as public order in other cities, including Birmingham, Manchester, and Liverpool, also broke down, it became harder to pin the violence on mindless criminality alone.

The BBC hosted a lively exchange between Edwina Currie (former Conservative MP) and West Indian columnist Darcus Howe.[2] Currie de-linked the present spate of civil violence in London from the violent rioting in Brixton in 1981, arguing that while deep-rooted racism was almost a ‘respectable’ trait in the 1980s, this was not the case now. And that youth violence today, regardless of race, is fuelled by a disconnect with society in general. In a hypothetical scenario she painted, a youth would turn to violence just to have ‘the trainers that Mum won’t buy me’ and through a lack of respect for private property, that is, not recognising the distinction between ‘what’s mine is mine, what’s yours is yours and I don’t touch it’. In response, Howe pointed out that young Black men continue to be a disenfranchised cohort, who are stereotyped by the police through their stop-and-search powers. Howe also indirectly questioned why that mother would not (or could not) buy running shoes for her son, or what meaning the concept of private property had for someone who had none.

These views characterise an important debate in understanding civil violence: whether it is perpetrated by mindless criminality, or whether there is a more structured anatomy of a riot. So how are we to understand the London riots? Here is a 3-step approach to understanding the ‘mindless criminal’:

Step 1 (at the macro-level): Right at the top of the list must be a recognition that civil violence, a term used to describe associated acts of violation and destruction, carried out as a sign of defiance against a central authority or between opposing groups of people, can occur in societies which we consider to be ‘modern and progressive’. There is no inherent fail-safe mechanism against the outbreak of civil violence in a modern democratic system, or in fact, any political system. Research on civil violence[3] shows us that violence can be a powerful (and emotive) mechanism to gain access to credibility and authority – for disenfranchised cohorts, this often is the most tangible means of asserting one’s identity or even gaining acceptance into social groups. This recognition keeps us from viewing the London riots as an outlandish anomaly, and in doing so, from justifying it as such.

Step 2 (at the meso-level): much has been reported about how the London rioters are destroying communities and neighbourhoods, the very fabric of society. So a second step would be to unpack why it is that shops and restaurants, often owned by known community members, were so predominantly targeted – was it because of the possibility of ‘stealing watches’, as per the clip shown repeatedly by the BBC? Quite possibly. Evidence from around the world suggests that looting and thievery form an integral part of civil violence. During the 1992-1993 riots in Mumbai, a city in India very prone to outbreaks of civil violence, for example, the police reported rioters hording mosquito repellent, cloth, TV sets and other items with a relatively low street-value. In London, it was predominantly ‘trainers…booze and fags’.[4]

Another reason for the looting might simply be that shops and restaurants are naturally the most ‘visible’ businesses from a street-view. And as such, might be seen as symbols of an economy that brings prosperity to some, but excludes others. The commonality between the various modalities of civil violence – rioting, arson, stone/missile throwing – is that they are all very ‘public’ forms of violence. There is no point in rioting in a private hall, hidden from public view. Riots, fires and scenes of stone pelting create powerful images of public disorder, which convey much more than the physical impact of the violence – they carry a message to a wider audience.

The act of looting, as much as the loot itself, is therefore of value to the looter – it symbolises defiance, identity and even (perversely) ability. These acts of violence can play important roles in signalling one’s ‘merit’ – something of tremendous importance to a disenfranchised teenager.

Step 3 (at the micro-level): Why don’t individuals ‘free-ride’? This is a simple question posed by Horowitz,[5] who asks why individuals with grievances don’t let others be violent on their behalf, and free-ride on the outcomes of the social turmoil. This question holds even though the risk of getting arrested is much lower when in a mob, since in the least, the risk of injury is still much higher in a riot. That is, why haven’t the London rioters sat back and watched, rather than instinctively taken part in the seemingly illogical acts of violence? When asked in this manner, the question seems to present the obvious answer – because there was a logic to perpetrating the violence. If the violence is against visible symbols of the prosperity that you are not a part of – if shops and restaurants are places you will never be able to provide custom to, or get a job in – then they seem distant from the turmoil of one’s own everyday needs. On the other hand, emotive acts of public violence can, and do, provide a sense belonging.

Viewed through this 3-step approach, it is evident that the London rioters are perhaps not the mindless criminals they are being made out to be. But neither can the recent events simply be seen as a spontaneous uprising of highly disenfranchised and emotive youth. While the riots need to be understood in the wider contexts of social, political and economic inequality, it also needs to be recognised that there is a certain structure to these acts of violence. The seemingly ‘mindless’ violence can in fact have very structured, even instrumental, underpinnings.

As per the Currie-Howe debate, here are some basic statistics to help you make up your own mind: unemployment in the UK for 16-24 years olds is up from 17.90% in the early 1990s to 19.70% in 2010, while London continues to have the highest unemployment rate for this cohort at 22%.[6] Currently, 22% of 19 year old boys in England do not have a basic education, while this figure drops to 15% for girls.[7] Black young adults (16-24 years) are four times as likely to be in prison under sentence, than White young adults, and almost eight times as likely as Asian young adults.[8] Nevertheless, the number of burglaries and violent incidents with injuries have dropped significantly since the 1990s – from 1.8 million burglaries in 1995 to 0.7 million this year, and from 2.4 million incidents to 1.2 million over the same time period. 50% of adults surveyed in 2000 believed that the crime rate was increasing, this figure has dropped to 28% now. And while 24% of adults reported being very worried about being the victim of violent crime in 2000, this year the figure has dropped to 13%.[9]

A final parting comment – both the Prime Minister and the Acting Commissioner of the Metropolitan Police are vociferously broadcasting a heavy-handed approach to bring the criminals responsible to justice. Research shows that prolonged ex-post policing (measures which increase police activity after the act of violence) can be linked in the long-run to an increase in social unrest.[10] Perhaps the PM’s comment that the violence is ‘wrecking your own life’,[11] further antagonises the very insecurities that cause youth to take part in such acts of civil violence.


[2] Newsnight 8th August 2011 – can be seen in the UK at http://www.bbc.co.uk/programmes/b013dv5k.

[3] Gupte, Jaideep. 2008. “Linking urban vulnerability, infra-power and ‘communal’ violence: extralegal security and policing in South Central, Mumbai.” In 9th Annual Global Development Network Conference on Security for Development: Confronting Threats to Survival and Safety Brisbane, Australia. Available at http://cloud2.gdnet.org/cms.php?id=document_download&document_id=13873

[5] Horowitz, Donald. 2001. The Deadly Ethnic Riot. Berkeley: University of California Press.

[6] Labour Force Survey, ONS.

[7] DfE publication based on matched administrative data, England; data for 2010. Taken from www.poverty.org.uk.

[8] Offender Management Caseload Statistics; Ministry of Justice; England and Wales, data for 2010.

[9] British Crime Survey, Home Office; England and Wales, average 2007/08 to 2009/10.

[10] Justino, P. 2007. Carrot or stick? Redistributive transfers versus policing in contexts of civil unrest. MICROCON Research Working Paper 3, Brighton: MICROCON. Available at http://www.microconflict.eu/publications/RWP3_PJ.pdf.

[11] David Cameron’s Downing Street statement on the riots, 9th August, 2011.

Introducing the MICROCON blog: Understanding violence and how it might be overcome

Posted by Patricia Justino.

Welcome to the MICROCON blog! MICROCON, or ‘A Micro Level Analysis of Violent Conflict’ is a five-year research programme funded by the European Commission, which takes an innovative micro level, multidisciplinary approach to the study of the conflict cycle. It is a five year programme, and has recently entered its final year.

Over the next 12 months, members of MICROCON’s 60-strong research team will be reflecting on the latest conflict research from around the world, as well as recent developments in countries affected by violent conflict. MICROCON is founded on the belief that micro-level analysis – at the level of individuals, households and small groups – is vital in understanding conflicts, how they can be prevented or curtailed, and how their effects can be mitigated.

 An important overall insight of MICROCON’s findings to date is that in each conflict there is a variety and combination of motives for engaging in violence – it is not possible to just talk about one that applies across conflicts. There are differences between leaders and followers; and also between individual motives and group motives. There are differences across conflicts, and causal factors also change over the course of conflicts. Given the complex range and combination of factors involved, strategies to prevent the (re-)emergence of violence need to be based on a micro-level appreciation of people’s strategies for coping with vulnerabilities to both socio-economic disadvantage and violence

This blog will seek to bring the micro-level expertise of our team of researchers to bear on current conflicts and to discuss the latest developments in conflict research, with a view to stimulating debate and engaging with anyone who is interested in discussing violent conflicts and how they might be overcome. So please do add your perspectives ‘below the line’ in the coming months, and please do get in touch to let us know what you think of the blog!